3.1. Measuring Uncertainty
3.1.1. Objective
In this course, we will delve into the concept of measurement uncertainty and explore the various factors that affect the amount of certainty in a measurement.
3.1.1.1. Background
Measurement uncertainty is the doubt that exists in a measured value due to limitations and imperfections in the measurement process. In this course, we will discuss several sources of measurement uncertainty, including random and systematic errors, element tolerance, measurement instrument error, measurement method error, and outside noise error.
3.1.1.2. Random Error: A Major Source of Uncertainty
Random error is a significant source of uncertainty in any measurement process. It is caused by factors that are difficult or impossible to control, such as fluctuations in temperature, pressure, voltage, and measurement instrument noise. These unpredictable and random fluctuations can affect the measurements and cause them to deviate from the true value.
To minimize the effects of random error, it is common practice to perform multiple measurements and calculate the average. This approach is based on the idea that the random errors in each individual measurement will be random and uncorrelated. Therefore, when multiple measurements are performed, the random errors tend to cancel out, and the average of the measurements will be closer to the true value than any single measurement. Other strategies to minimize the effects of random error include using more precise measurement instruments that are less susceptible to fluctuations.
In conclusion, random error is an important consideration when performing measurements, and it is essential to understand the sources of uncertainty and minimize their effects. By performing multiple measurements and using more precise measurement instruments when possible, we can reduce uncertainty and obtain more accurate measurement results.
3.1.1.3. Systematic Error: A Systematic Deviation from the True Value
Systematic error, unlike random error, is a constant deviation from the true value that occurs in every measurement. Systematic error is an important concept in experimental research because it can significantly affect the accuracy and precision of measurements. For example, if a scale used to measure weight is consistently off by a certain amount, it will produce systematic error in every measurement. If this error is not accounted for, it can lead to incorrect conclusions or inaccurate data. To reduce or eliminate systematic error, researchers may need to adjust their instruments or measurement methods, or take additional steps to control environmental factors.
To illustrate the practical implications of systematic error, consider the example of measuring blood pressure using a sphygmomanometer (blood pressure cuff). If the cuff is too small or too large for the patient, or if it is not properly calibrated, it can produce systematic error in every measurement. This error can be significant enough to affect the diagnosis and treatment of the patient. To avoid systematic error in this case, healthcare providers must ensure that the cuff is the appropriate size for the patient, and that it is calibrated regularly to ensure accuracy.
In scientific research, systematic error can also be caused by biases in the experimental design or data analysis. For example, if researchers unintentionally select participants who are more likely to produce a certain result, or if they analyze the data in a way that is biased towards a particular outcome, they can introduce systematic error into their findings. To minimize these types of errors, researchers must use rigorous methods for participant selection and data analysis, and must take steps to avoid biases in their experimental design.
3.1.1.4. Effect of element tolerance on uncertainty
For example, a resistor with a nominal value of 1 kΩ and a tolerance of 5% may have an actual value of anywhere between 950 Ω and 1050 Ω. If this resistor is used in a circuit to measure resistance, the actual value of the resistor will affect the measurement result, leading to uncertainty in the measurement.
To minimize the effect of element tolerance on measurement uncertainty, it is important to use elements with tight tolerances or to calibrate the elements to their actual values before use. This can be done by measuring the actual values of the elements using precision instruments and adjusting the circuit parameters accordingly.
3.1.1.5. Measurement instrument error
In practical applications, element tolerance can have a significant impact on measurement uncertainty. For example, in electronic circuits, resistors and capacitors are often used to control the flow of current and voltage. However, the actual values of these elements may deviate from their nominal values due to manufacturing variations or environmental factors. This can lead to measurement errors and reduce the accuracy and precision of the circuit.
To minimize the effect of element tolerance on measurement uncertainty, it is important to select elements with tight tolerances or to calibrate the elements to their actual values before use. This can be done by measuring the actual values of the elements using precision instruments and adjusting the circuit parameters accordingly. For example, if a 1 kΩ resistor is found to have an actual value of 990 Ω, the circuit parameters can be adjusted to compensate for this deviation and improve the accuracy of the measurement.
In addition to element tolerance, other factors can also contribute to measurement uncertainty, such as noise, interference, and drift. To ensure accurate and precise measurements, it is important to identify and control these sources of uncertainty through careful experimental design, calibration, and data analysis. This requires a systematic approach to measurement and a thorough understanding of the underlying physical principles and mathematical models involved in the measurement process. By minimizing measurement uncertainty, researchers and engineers can improve the reliability and validity of their experimental results and make more informed decisions based on the data.
3.1.1.6. Outside noise error
Examples of outside noise error include electromagnetic interference (EMI) from nearby electronic devices, vibrations from mechanical sources, and temperature fluctuations. These factors can cause fluctuations in the measurement signal and introduce measurement uncertainty. To minimize outside noise error, researchers and engineers may use shielding materials, isolate the measurement setup from external sources of interference, or use active noise cancellation techniques.
For example, in neuroscience research, electroencephalography (EEG) is often used to measure brain activity. However, the EEG signal can be affected by external sources of noise, such as electrical interference from nearby equipment. To minimize outside noise error in EEG measurements, researchers may use shielding materials and grounded cables to reduce electromagnetic interference, or place the measurement setup in a shielded room with controlled temperature and humidity.
In addition to external factors, outside noise error can also be caused by limitations in the measurement equipment or methods. For example, if the resolution of a sensor is not sufficient to detect small changes in the measurement signal, this can lead to measurement uncertainty and errors. To minimize these types of errors, researchers and engineers must carefully select and calibrate their measurement equipment, and use appropriate statistical techniques to quantify and control measurement uncertainty. By minimizing outside noise error, researchers and engineers can improve the accuracy and precision of their measurements, and reduce the likelihood of erroneous conclusions or decisions based on flawed data.
3.1.2. Hands on Experiment: Measuring Uncertainty in Voltage Measurement using Red Pitaya
In scientific experiments, it is important to consider the uncertainty associated with each measurement. The uncertainty is influenced by the quality of the measurement instruments and the accuracy of the circuit being measured. In this experiment, we will use Red Pitaya to measure the uncertainty in voltage measurement using a simple voltage divider circuit.
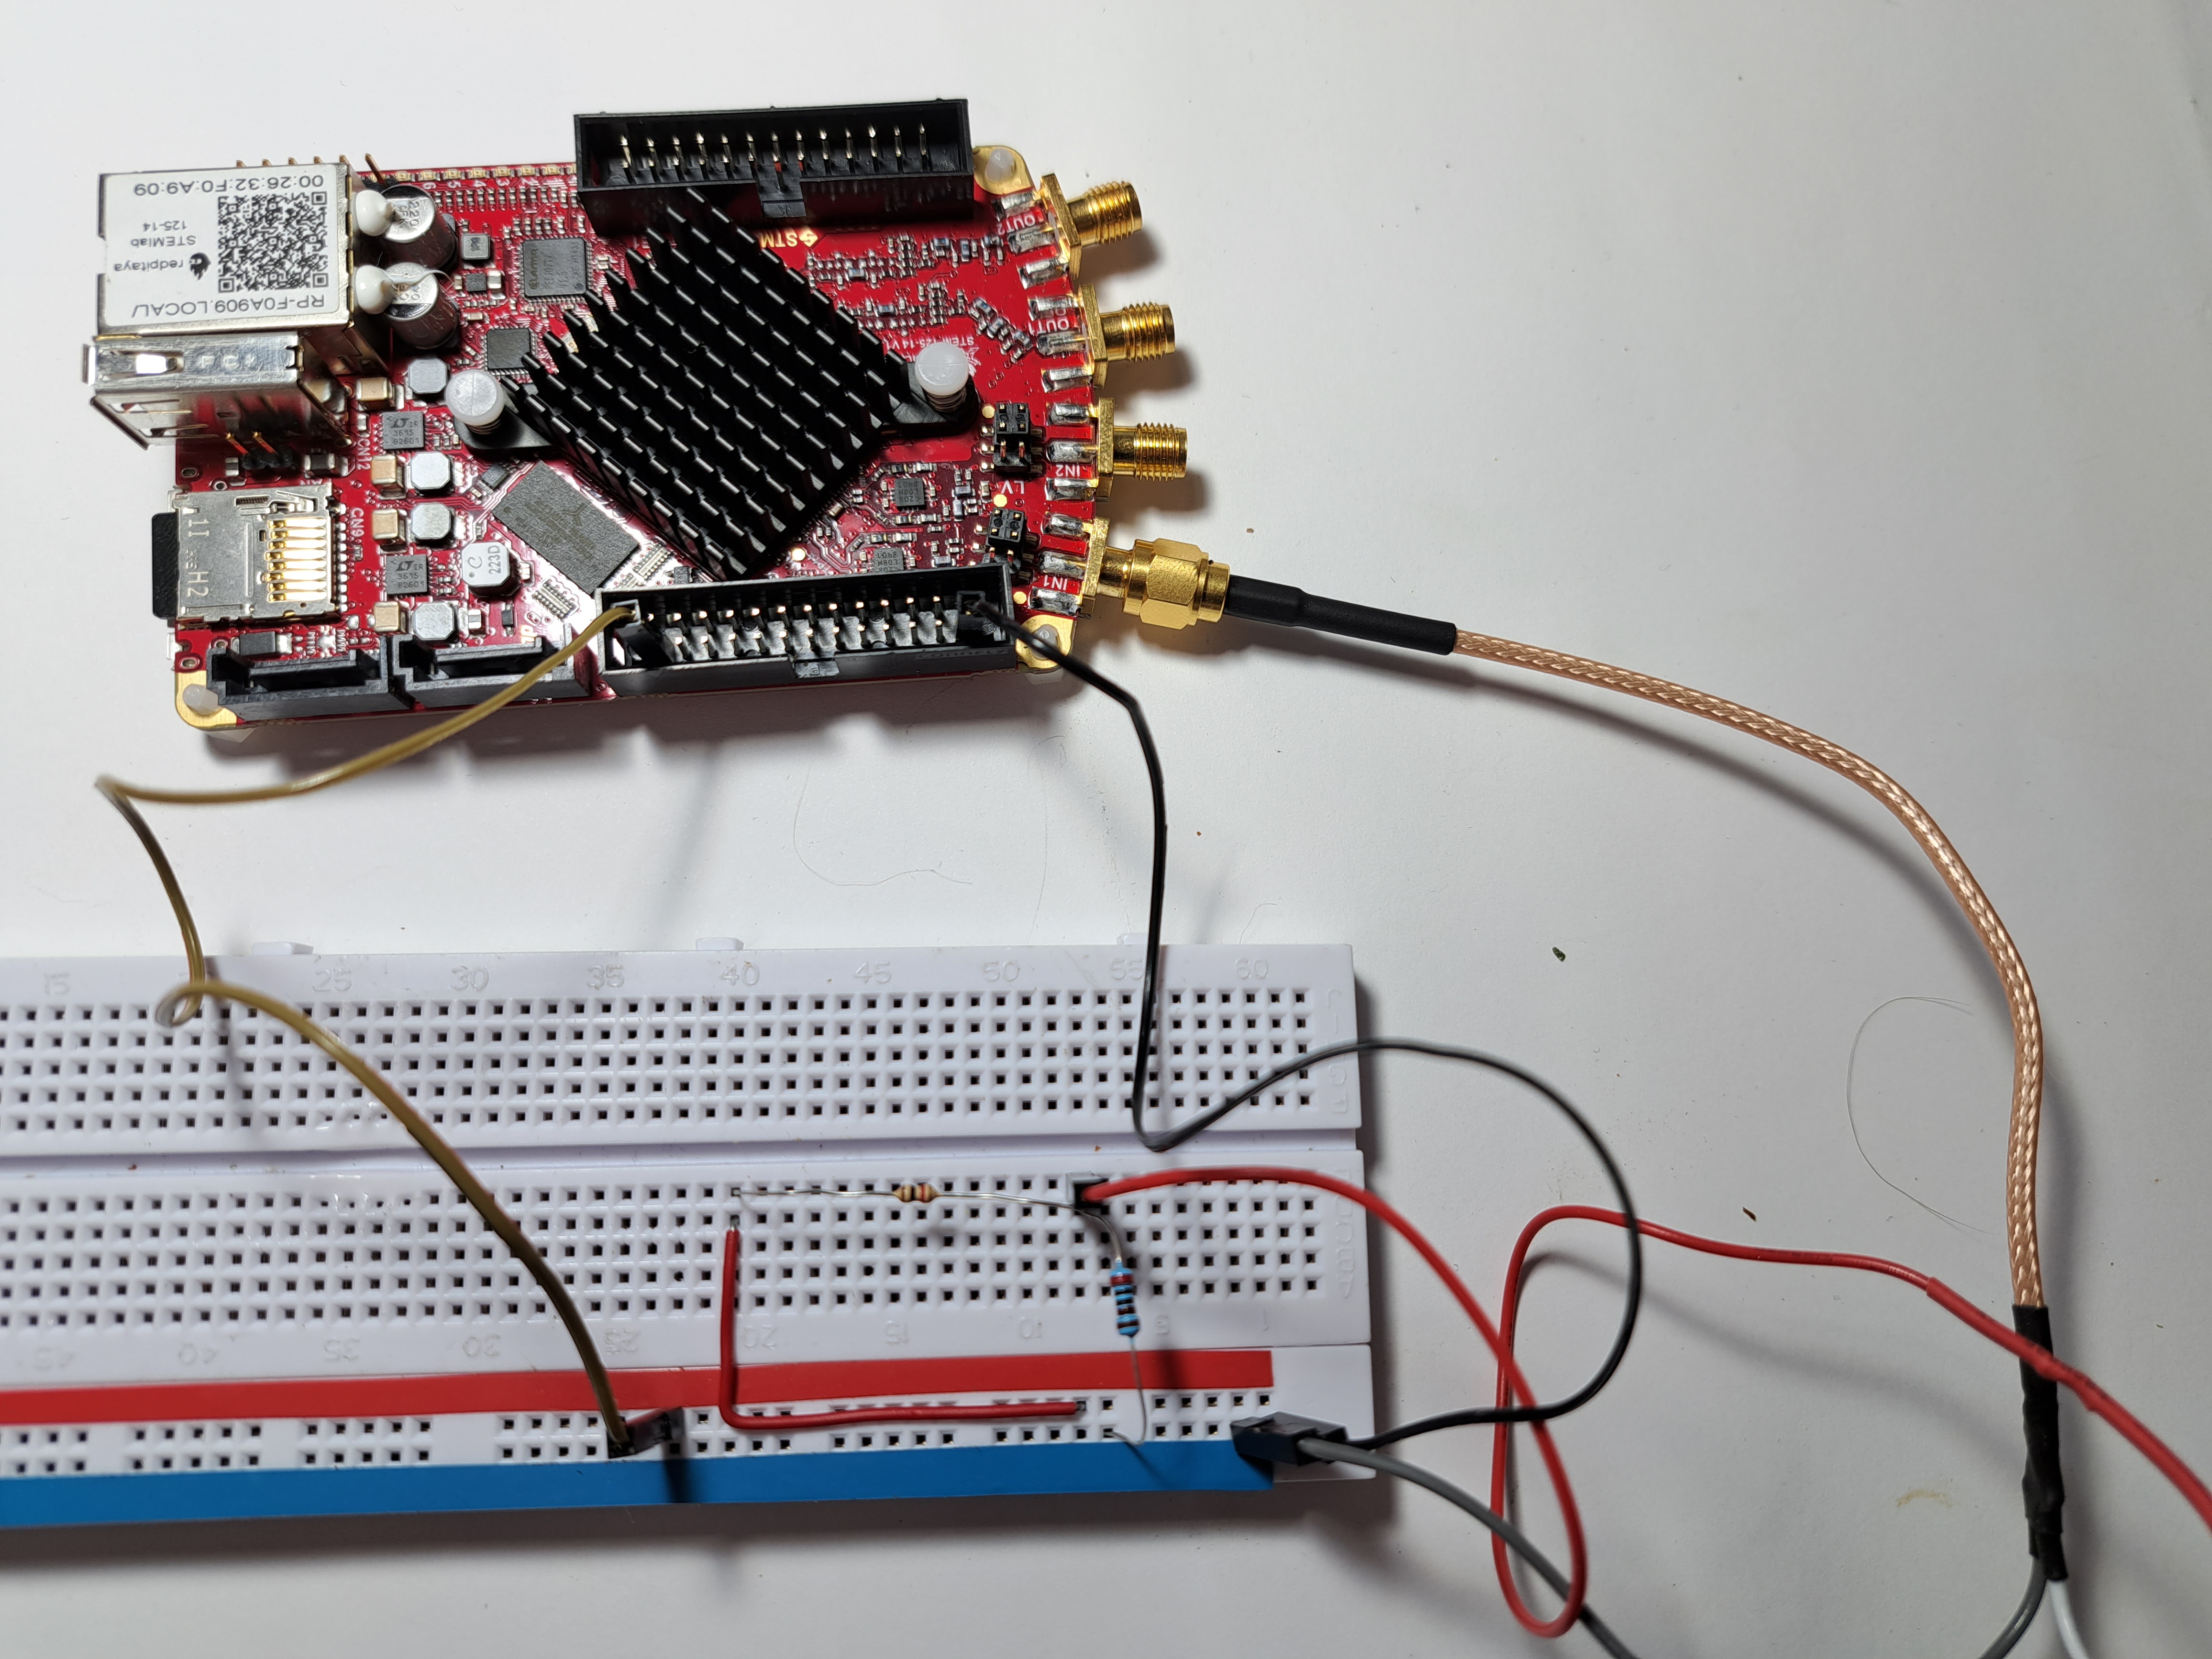
Connect the two resistors in series on a breadboard, forming a voltage divider circuit. Connect the positive terminal of the voltage source to one end of the resistor chain and the negative terminal to the other end. Connect the Red Pitaya board to the voltage divider circuit using jumper wires, with one input connected to the voltage source and the other input connected to the junction between the two resistors. To power the circuit we will use Red Pitaya’s 5V Output pin.
For help with the wiring you can use the image bellow:
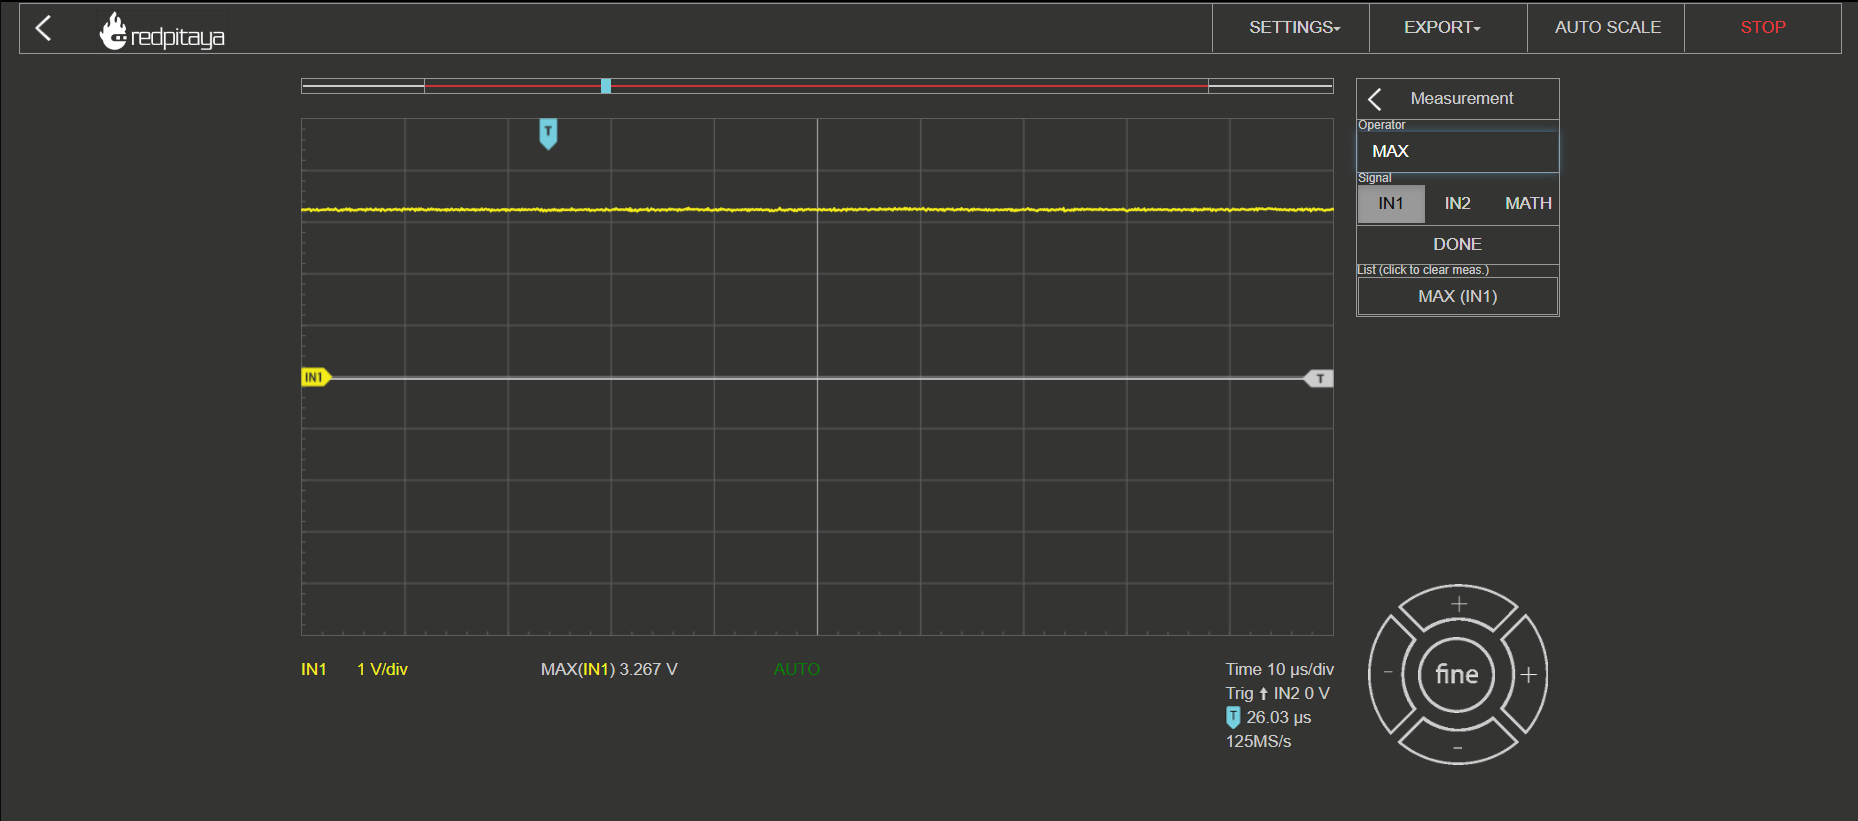
Open the Red Pitaya oscilloscope app and set the meas function to measure peak voltages. Bellow the graph voltages of resitors should be displayed. Repeat the measurement 10 times, and record the voltage reading displayed by the Red Pitaya each time. Calculate the average voltage reading and the standard deviation of the measurements to determine the uncertainty in the voltage measurement.
Repeat the measurement with the higher value resistor and compare the uncertainties in the two measurements.
3.1.2.1. Results
The voltage divider circuit has R1 = 2kΩ, R2 = 1kΩ, and an input voltage of 5V. We took 10 measurements of the voltage across resistor R1 using Red Pitaya. We got the following readings:
x_R1 = [3.262, 3.275, 3.281, 3.268, 3.254, 3.257, 3.249, 3.276, 3.263, 3.278]
If you are measuring in the HV range of ±20V with a 14-bit resolution, the voltage resolution of your measurement system can be calculated as follows:
The range of the ADC is 2^14 = 16384 levels, which corresponds to the range of the input voltage of ±20V. Therefore, each level of the ADC represents a voltage range of:
Voltage range per level = (±20V) / 16384 = ±0.00122
This means that the voltage resolution of your measurement system is approximately ±0.00122.
3.1.2.2. Calculating standart deviation
To calculate the standard deviation for the voltage measurements, we can use the following formula:
where x represents the individual voltage measurements, x_mean is the mean voltage value, n is the number of measurements, and ^2 represents squaring. Using this formula, we can calculate the standard deviation for the 10 measurements of the voltage across R1 as follows:
Calculate the squared differences from the mean for each measurement:
Sum the squared differences and divide by the number of measurements minus 1:
Therefore, the standard deviation for the 10 measurements of the voltage across R1 is approximately 0.0042V.
However, it is important to note that the voltage uncertainty of your measurement system is also affected by other factors, such as noise, calibration accuracy, and stability of the measurement system. These factors can contribute to the overall uncertainty of your voltage measurement, which should be taken into account when analyzing and reporting your measurement results.
Written by Andraž Pirc
This teaching material was created by Red Pitaya & Zavod 404 in the scope of the Smart4All innovation project.